


- 고객지원
- 업무안내│제품문의
- 전화번호│02-2081-2510
- Email │support@takara.co.kr
- 대전지사
- 업무안내│대전/충청지역 주문, 제품문의
- 전화번호│042-828-6525
- Email │tkbd@takara.co.kr
- 업무시간안내
- [ 평 일 ] 09 : 00 ~ 18 : 00 │ [ 점심시간 ] 12 : 00 ~ 13 : 00
- 토·일요일, 공휴일은 휴무입니다.
[Cancer Research] Cancer biomarker discovery


Plasma-seq을 통한 전립선암 biomarker 연구
암을 조기에 발견하는 것은 암의 발생 과정을 확인하는데 중요할 뿐만 아니라, 보다 빠른 치료를 통해 환자의 생존 및 삶의 질을 향상시킬 수 있다. Circulating tumor DNA (ctDNA)는 사멸 혹은 괴사되는 세포에서 유래하며, 악성 종양의 특징을 보인다. 혈장으로부터 분리된 ctDNA는 진단이나 종양의 조기 발견, 예후, 무질병생존기간 등 다양한 정보를 포함하고 있는 특이적이고 민감한 바이오 마커를 제공한다. 게다가, 치료에 대한 저항성과 확률을 예측하는 데에도 사용될 수 있다. 최근, 두 연구 그룹에서 ctDNA와 plasma-seq 기술로 전립선 암에 대한 바이오 마커를 확인하고, 신경종에 대한 copy number variations (CNVs)과 DNA fragmentation 패턴을 분석한 논문을 발표하였다.
Profiling prostate cancer biomarkers
스웨덴 스톡홀름에 위치한 Karolinska Institute의 연구자들은 ThruPLEX 기술을 이용해 metastatic castration-resistant prostate cancer (mCRPC) 유래의 cell-free DNA (cfDNA)를 분석한 논문을 발표하였다.
본 논문의 저자들은 200명 이상의 환자를 대상으로, 백혈구의 germline DNA와 다른 연구에서 사용한 암 조직 생검 DNA를 비교하여 cfDNA가 전립선 암에서 나타나는 마커를 검출하는데 얼마나 효과적인지를 연구하였다. 이 연구에서는 Androgen receptor (AR)를 분석하였으며, fourth-line 환자들과 비교했을 때 first-line mCRPC 치료 환자들에서 현저히 낮은 AR 내 구조적 변이와 지속적인 유전자 변이를 확인하였다 (그림 1). 또한 100 pg - 50 ng의 cfDNA로부터 low depth를 이용해 WGS를 수행하고, 타겟 부위는 더 높은 depth로 분석하였다.
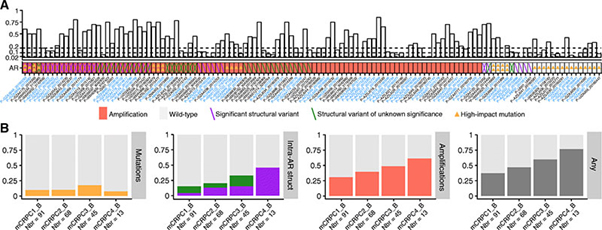
그림 1. AR 변이 확인
Comprehensive profiling of AR was performed in 275 cell-free DNA samples from 177 mCRPC patients.
(Panel A) The upper part of Panel A displays the circulating tumor DNA fraction. The dashed lines at 0.02, 0.10, and 0.20 denote the cutoffs to reliably detect point mutations, loss of heterozygosity, and homozygous deletions, respectively. The lower part of Panel A displays a heatmap of the mutational landscape detected in the androgen receptor from circulating tumor DNA profiling. Type of alteration is coded according to the bottom legend. For visualization purposes, only samples with an alteration are shown here (126 samples from 89 individuals). Up to two mutations or structural variants (forward and backslashes) are displayed per sample. X-axis: cell-free DNA samples sorted according to the number of alterations detected. Patients with multiple samples are colored in blue. Asterisks indicate samples with microsatellite instability.
(Panel B) The fraction of patients with alterations in the androgen receptor are categorized by type of alteration and line of therapy. Only high-impact mutations, e.g., hotspot mutations, are shown here. Intra-AR structural variation is colored according to the legend in Panel A. The rightmost bar plot represents the fraction of patients with any alteration in the androgen receptor. Abbreviations: mCRPC[number], metastatic castration-resistant prostate cancer and line of therapy; _B, baseline; Nbr, number of samples profiled. Diagram and caption were adapted from Mayrhofer et al. 2018, and used under Creative Commons Attribution 4.0 International License.
Discerning glioma CNVs and DNA fragmentation patterns
또 다른 논문에서는 ThruPLEX 기술을 이용해서 낮은 비용으로 빠르게 신경종 환자를 스크리닝 하는 분석법을 개발하였다. 신경종은 뇌와 척수 내 존재하는 신경 세포에 발생하는 종양이다.
EMBO Molecular Medicine에서 출간한 가장 최근의 논문을 확인해보면, Cancer UK 연구자들은 뇌척수액 내 존재하는 cell-free tumor DNA (cftDNA)로부터 CNV를 검출하여, 낮은 비용으로 신경종을 분석하는 새로운 분석을 개발해 냈다. 이 기술은 그간 혈장 내에서 확인이 어려웠던 신경종을 뇌척수액 내 cftDNA를 샘플로 이용함으로써 somatic copy number alternations (SCNAs)와 DNA fragmentation 패턴을 shallow sequencing으로 분석한다 (그림 2).
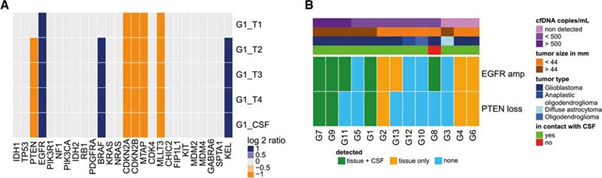
그림 2. 암 병기, cfDNA 농도에 따른 뇌척수액 내의 SCNAs 검출과 종양과 CSF의 관계
(Panel A) Heat map summarizing the SCNAs detected by shallow whole genome sequencing of 28 genes of interest in tumor biopsies and CSF from patient G1 (four tumor subparts and one CSF sample). Amplifications are shown in dark blue, deletions are in orange, and copy number neutral regions are in light gray.
(Panel B) Heat map summarizing detection of EGFR and PTEN alterations in tumor tissue and in CSF samples. Shared detection in tissue and CSF is indicated in green, detection of the alteration only in tissue in orange, and non-detection in blue. The top bars indicate the cfDNA concentration (copies/ml; in a range of purples), the size of the tumors (in a range of browns), the type of glioma (in a range of blues), and whether the tumor was in direct contact with the CSF or not (based on MRI, green or red, respectively). Samples are ranked from left to right by decreasing concentration of cfDNA (copies/ml). Diagram and caption were adapted from Mouliere et al. 2018 and used under Creative Commons Attribution 4.0 International License.
Future of cftDNA analysis
최근의 유전자 Sequencing 분석 기술의 진보로, 침습을 최소화하여 암의 진단이나 종양 모니터링이 가능해 졌다. 단일 부위의 생검은 액체 생검으로 검출해 낼 수 있는 종양 내 이질성 (Heterogeneity)을 확인할 수 없다. 이러한 대체 샘플들을 이용함으로써 침습적으로 진행되는 조직 생검의 필요성이 사라지고 있다. 하지만, 액체 생검을 분석하는 것에도 어려움이 있어 ThruPLEX와 같은 기술을 이용하는 것이 중요하다. ThruPLEX 기술을 이용하면, cfDNA 분석 과정을 간단하게 최적화하고, 최소한의 sequencing depth를 이용해 high-throughput으로 high-quality 판독을 가능케 함으로써 액체 생검을 광범위하게 적용시킬 수 있다.
[원문] Advancing cancer research with plasma-seq
[참고문헌]
- Mayrhofer, M. et al., Cell-free DNA profiling of metastatic prostate cancer reveals microsatellite instability, structural rearrangements and clonal hematopoiesis. Genome Med. 10, (2018).
- Mouliere, F. et al., Detection of cell-free DNA fragmentation and copy number alterations in cerebrospinal fluid from glioma patients. EMBO Mol. Med. e9323, (2018).
암을 조기에 발견하는 것은 암의 발생 과정을 확인하는데 중요할 뿐만 아니라, 보다 빠른 치료를 통해 환자의 생존 및 삶의 질을 향상시킬 수 있다. Circulating tumor DNA (ctDNA)는 사멸 혹은 괴사되는 세포에서 유래하며, 악성 종양의 특징을 보인다. 혈장으로부터 분리된 ctDNA는 진단이나 종양의 조기 발견, 예후, 무질병생존기간 등 다양한 정보를 포함하고 있는 특이적이고 민감한 바이오 마커를 제공한다. 게다가, 치료에 대한 저항성과 확률을 예측하는 데에도 사용될 수 있다. 최근, 두 연구 그룹에서 ctDNA와 plasma-seq 기술로 전립선 암에 대한 바이오 마커를 확인하고, 신경종에 대한 copy number variations (CNVs)과 DNA fragmentation 패턴을 분석한 논문을 발표하였다.
Profiling prostate cancer biomarkers
스웨덴 스톡홀름에 위치한 Karolinska Institute의 연구자들은 ThruPLEX 기술을 이용해 metastatic castration-resistant prostate cancer (mCRPC) 유래의 cell-free DNA (cfDNA)를 분석한 논문을 발표하였다.
본 논문의 저자들은 200명 이상의 환자를 대상으로, 백혈구의 germline DNA와 다른 연구에서 사용한 암 조직 생검 DNA를 비교하여 cfDNA가 전립선 암에서 나타나는 마커를 검출하는데 얼마나 효과적인지를 연구하였다. 이 연구에서는 Androgen receptor (AR)를 분석하였으며, fourth-line 환자들과 비교했을 때 first-line mCRPC 치료 환자들에서 현저히 낮은 AR 내 구조적 변이와 지속적인 유전자 변이를 확인하였다 (그림 1). 또한 100 pg - 50 ng의 cfDNA로부터 low depth를 이용해 WGS를 수행하고, 타겟 부위는 더 높은 depth로 분석하였다.
그림 1. AR 변이 확인
Comprehensive profiling of AR was performed in 275 cell-free DNA samples from 177 mCRPC patients.
(Panel A) The upper part of Panel A displays the circulating tumor DNA fraction. The dashed lines at 0.02, 0.10, and 0.20 denote the cutoffs to reliably detect point mutations, loss of heterozygosity, and homozygous deletions, respectively. The lower part of Panel A displays a heatmap of the mutational landscape detected in the androgen receptor from circulating tumor DNA profiling. Type of alteration is coded according to the bottom legend. For visualization purposes, only samples with an alteration are shown here (126 samples from 89 individuals). Up to two mutations or structural variants (forward and backslashes) are displayed per sample. X-axis: cell-free DNA samples sorted according to the number of alterations detected. Patients with multiple samples are colored in blue. Asterisks indicate samples with microsatellite instability.
(Panel B) The fraction of patients with alterations in the androgen receptor are categorized by type of alteration and line of therapy. Only high-impact mutations, e.g., hotspot mutations, are shown here. Intra-AR structural variation is colored according to the legend in Panel A. The rightmost bar plot represents the fraction of patients with any alteration in the androgen receptor. Abbreviations: mCRPC[number], metastatic castration-resistant prostate cancer and line of therapy; _B, baseline; Nbr, number of samples profiled. Diagram and caption were adapted from Mayrhofer et al. 2018, and used under Creative Commons Attribution 4.0 International License.
Why is this important?
cfDNA는 암 진단, 예후, 마커 확인에 매우 유용하게 활용될 수 있으며, 특히 혈장 샘플로부터 추출된 cfDNA는 조직 생검에 비해 훨씬 덜 침습적이고, 질병의 진행을 더 잘 이해할 수 있다. Large-scale로 cfDNA를 분석할 때, high-throughput의 sequencing 기술과 접목시킴으로써 실험별 차이를 최소화하고 민감도를 높일 수 있기에 매우 중요하다.
cfDNA는 암 진단, 예후, 마커 확인에 매우 유용하게 활용될 수 있으며, 특히 혈장 샘플로부터 추출된 cfDNA는 조직 생검에 비해 훨씬 덜 침습적이고, 질병의 진행을 더 잘 이해할 수 있다. Large-scale로 cfDNA를 분석할 때, high-throughput의 sequencing 기술과 접목시킴으로써 실험별 차이를 최소화하고 민감도를 높일 수 있기에 매우 중요하다.
Discerning glioma CNVs and DNA fragmentation patterns
또 다른 논문에서는 ThruPLEX 기술을 이용해서 낮은 비용으로 빠르게 신경종 환자를 스크리닝 하는 분석법을 개발하였다. 신경종은 뇌와 척수 내 존재하는 신경 세포에 발생하는 종양이다.
EMBO Molecular Medicine에서 출간한 가장 최근의 논문을 확인해보면, Cancer UK 연구자들은 뇌척수액 내 존재하는 cell-free tumor DNA (cftDNA)로부터 CNV를 검출하여, 낮은 비용으로 신경종을 분석하는 새로운 분석을 개발해 냈다. 이 기술은 그간 혈장 내에서 확인이 어려웠던 신경종을 뇌척수액 내 cftDNA를 샘플로 이용함으로써 somatic copy number alternations (SCNAs)와 DNA fragmentation 패턴을 shallow sequencing으로 분석한다 (그림 2).
그림 2. 암 병기, cfDNA 농도에 따른 뇌척수액 내의 SCNAs 검출과 종양과 CSF의 관계
(Panel A) Heat map summarizing the SCNAs detected by shallow whole genome sequencing of 28 genes of interest in tumor biopsies and CSF from patient G1 (four tumor subparts and one CSF sample). Amplifications are shown in dark blue, deletions are in orange, and copy number neutral regions are in light gray.
(Panel B) Heat map summarizing detection of EGFR and PTEN alterations in tumor tissue and in CSF samples. Shared detection in tissue and CSF is indicated in green, detection of the alteration only in tissue in orange, and non-detection in blue. The top bars indicate the cfDNA concentration (copies/ml; in a range of purples), the size of the tumors (in a range of browns), the type of glioma (in a range of blues), and whether the tumor was in direct contact with the CSF or not (based on MRI, green or red, respectively). Samples are ranked from left to right by decreasing concentration of cfDNA (copies/ml). Diagram and caption were adapted from Mouliere et al. 2018 and used under Creative Commons Attribution 4.0 International License.
Why is this important?
이 분석법은 sequencing 비용이라는 중요한 문제를 해결하는 데 도움을 줄 수 있다. Mutation 대신 CNV와 DNA fragmentation을 분석함으로써, sequencing depth를 현저히 낮출 수 있다. 다르게 표현하자면, 연구자들은 적은 비용으로 신뢰도 있는 분석이 가능하고, 이를 통해 환자로 예상되는 경우만 추가로 더 자세한 sequencing을 진행할 수 있다. 이러한 접근 방식은 다른 조건이나 다른 형태의 암에도 적용될 수 있다. 선택적으로 Sequencing을 진행함으로써 빠르고 간단한 분석이 가능하며, 이로 인해 소요 시간과 sequencing 비용을 최소화할 수 있다.
이 분석법은 sequencing 비용이라는 중요한 문제를 해결하는 데 도움을 줄 수 있다. Mutation 대신 CNV와 DNA fragmentation을 분석함으로써, sequencing depth를 현저히 낮출 수 있다. 다르게 표현하자면, 연구자들은 적은 비용으로 신뢰도 있는 분석이 가능하고, 이를 통해 환자로 예상되는 경우만 추가로 더 자세한 sequencing을 진행할 수 있다. 이러한 접근 방식은 다른 조건이나 다른 형태의 암에도 적용될 수 있다. 선택적으로 Sequencing을 진행함으로써 빠르고 간단한 분석이 가능하며, 이로 인해 소요 시간과 sequencing 비용을 최소화할 수 있다.
Future of cftDNA analysis
최근의 유전자 Sequencing 분석 기술의 진보로, 침습을 최소화하여 암의 진단이나 종양 모니터링이 가능해 졌다. 단일 부위의 생검은 액체 생검으로 검출해 낼 수 있는 종양 내 이질성 (Heterogeneity)을 확인할 수 없다. 이러한 대체 샘플들을 이용함으로써 침습적으로 진행되는 조직 생검의 필요성이 사라지고 있다. 하지만, 액체 생검을 분석하는 것에도 어려움이 있어 ThruPLEX와 같은 기술을 이용하는 것이 중요하다. ThruPLEX 기술을 이용하면, cfDNA 분석 과정을 간단하게 최적화하고, 최소한의 sequencing depth를 이용해 high-throughput으로 high-quality 판독을 가능케 함으로써 액체 생검을 광범위하게 적용시킬 수 있다.
Code |
제품명 |
용량 |
R400674 |
24회 |
|
R400741 |
24회 |
[원문] Advancing cancer research with plasma-seq
[참고문헌]
- Mayrhofer, M. et al., Cell-free DNA profiling of metastatic prostate cancer reveals microsatellite instability, structural rearrangements and clonal hematopoiesis. Genome Med. 10, (2018).
- Mouliere, F. et al., Detection of cell-free DNA fragmentation and copy number alterations in cerebrospinal fluid from glioma patients. EMBO Mol. Med. e9323, (2018).
